Nielsen Innovation Studio
A platform application that modernizes Nielsen’s approach to concept testing, improves profitability, and prepares the Practice for a digital future.
A platform application that modernizes Nielsen’s approach to concept testing, improves profitability, and prepares the Practice for a digital future.
After a decade being a services-based consultancy delivering only hard-copy reports to clients, Affinnova (later acquired by Nielsen) was bringing their concept testing methodologies into the digital world by pivoting on a patented “evolutionary algorithm”.
A strong need to go to market required rapid prototyping, using Bootstrap as a front-end framework, in which Proof-of-Concepts were created expeditiously while development teams prepared a platform that would enable a digital future. Modular groundwork for the process in which products are dependent upon needed to be done first. In order to provide a holistic experience that supports multiple personas with asynchronous roles, automating inadequacies and streamlining workflows, a Minimum Viable Product was quickly conceived.
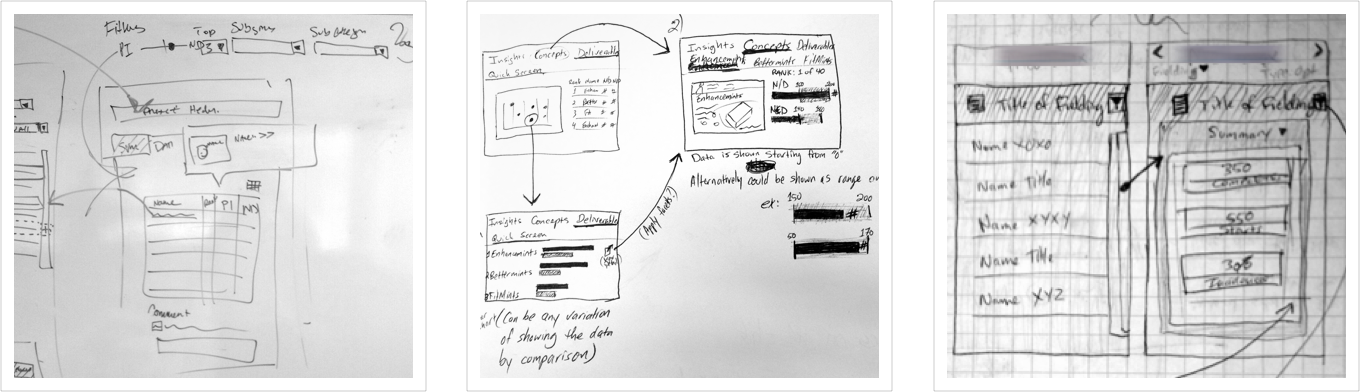
Sketches for what would eventually become Field Monitoring and Interactive Reporting
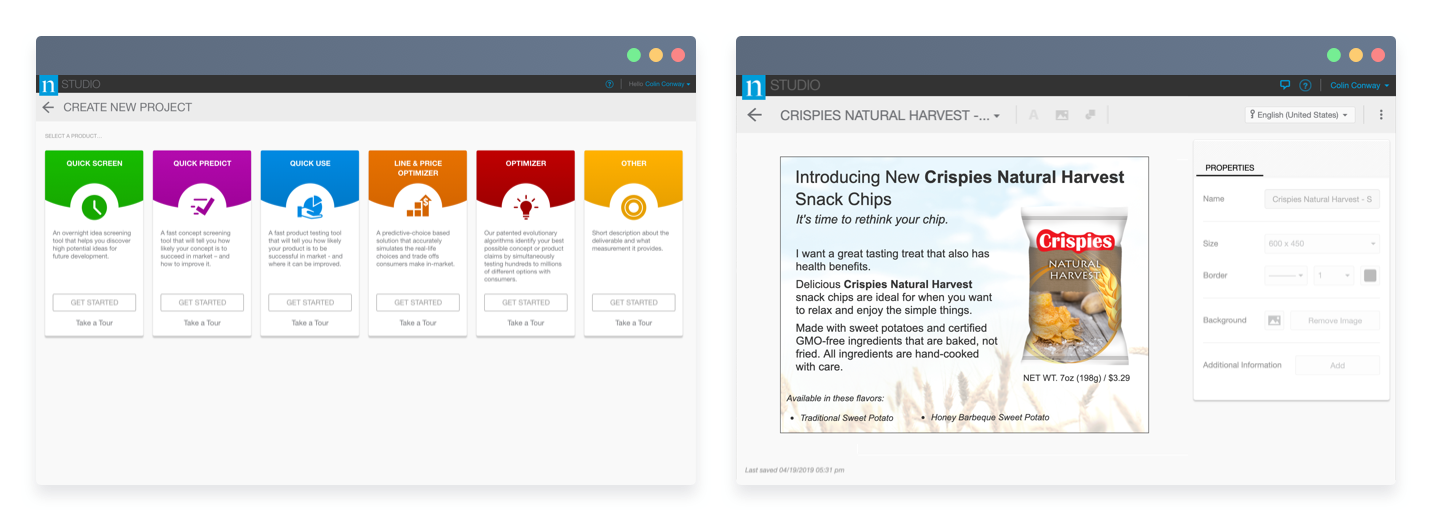
A lot of the discovery phase in Quick Screen was derived from the heavy lifting in the early stages of Quick Predict before methodologies were separated into their own respective products. Learnings from Quick Predict were used, and Quick Screen later took on the up to date look and feel to give the products an almost identical look and feel. The only exception in the case of Quick Screen is that it is lightweight and less feature-dense by comparison.
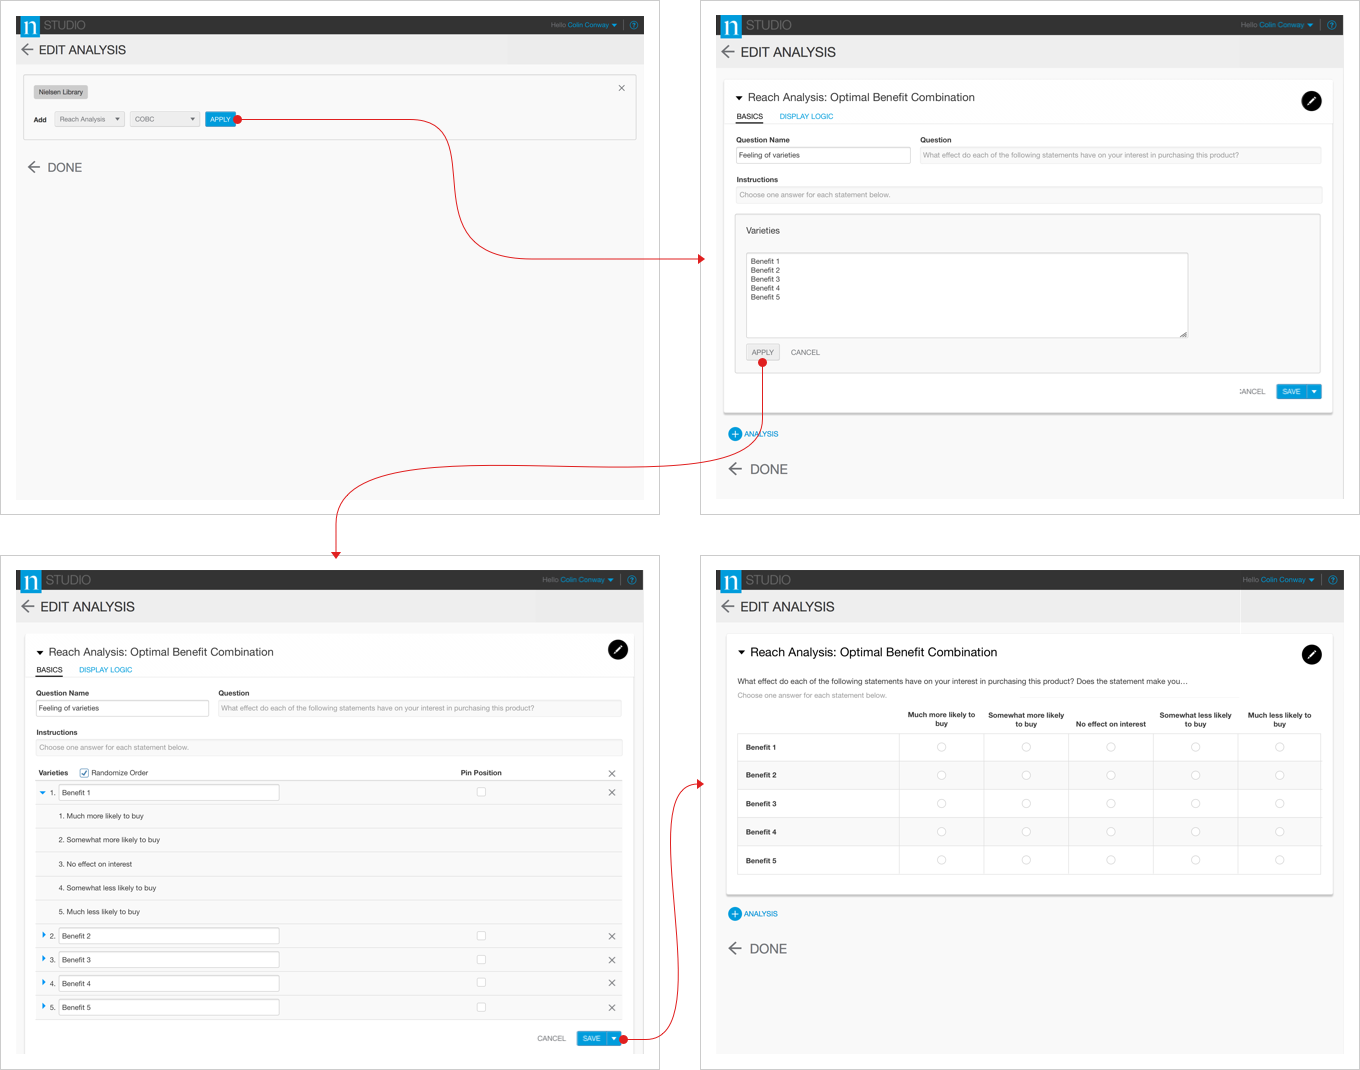
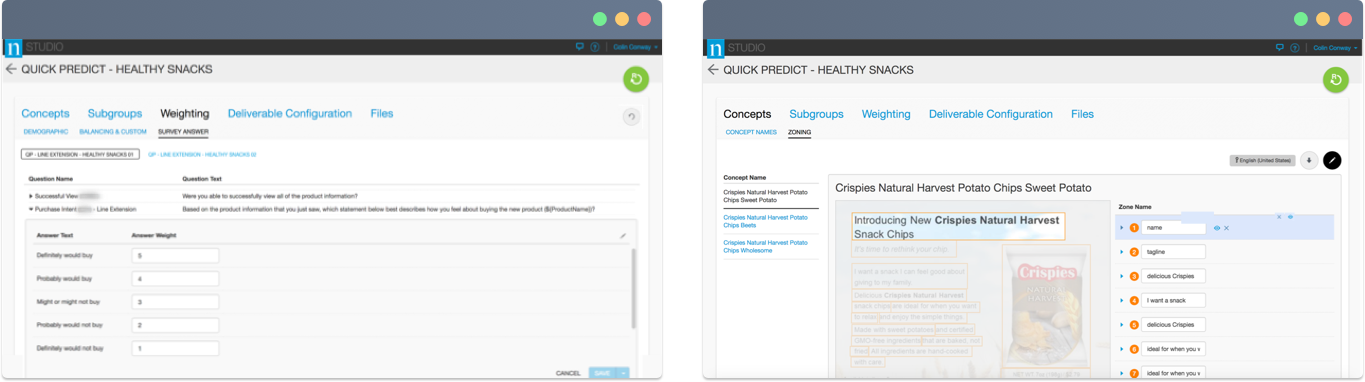
With a sensitivity to becoming an eventual client-facing workflow, automation for Just About Right questions and answer scales that, from an analyst’s perspective, was already an arduous process. The challenge therein was finding a way to simulataneously direct and educate a new user how the attribute answer scales work for each statement in a streamlined, intuitive way while limiting instructional text or jargon. Many variations of the workflow were tested and the victor, a “mad libs” approach was the sweet-spot solution in guiding the input of adjectives for standardized statements while showing how the answer scale changes when one attribute is used versus two. Statements are then loaded sequentially and propagate into their respective positions for singular editing if revisions need to be made, instead of the original bulk edit process.
One of many similar workflows based off of templates for custom screener and diagnostic questions to be shown to participants in the survey.
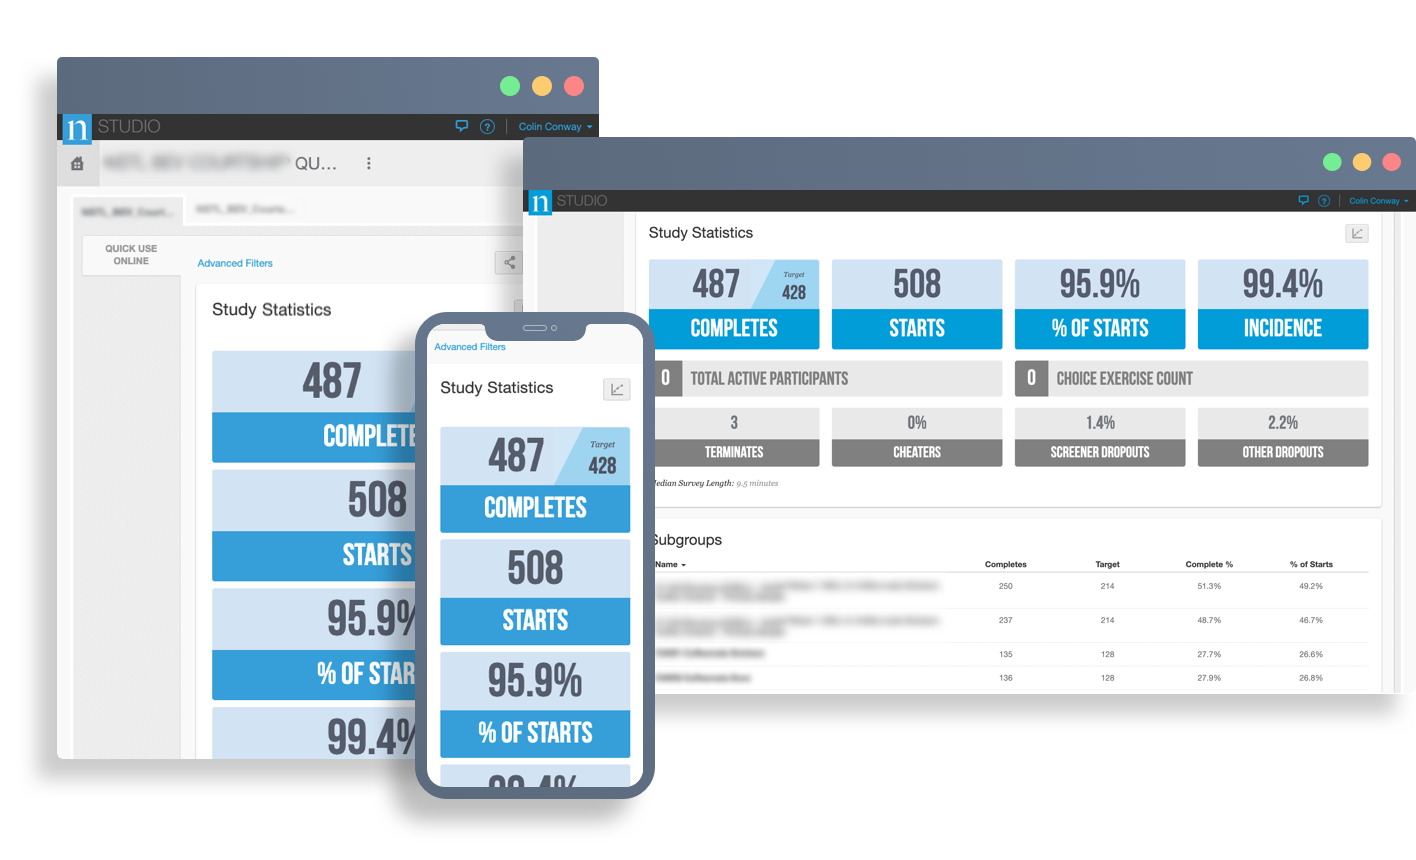
A utility that gives analysts a comprehensive view of live participant data: completion rates, sample and quota sizes. Filtering for granular detail on answers, survey duration and respondents ensure incoming data quality and provide augmentations when needed. A mobile view was also created in order for analysts and panel providers to remotely view live field statistics.
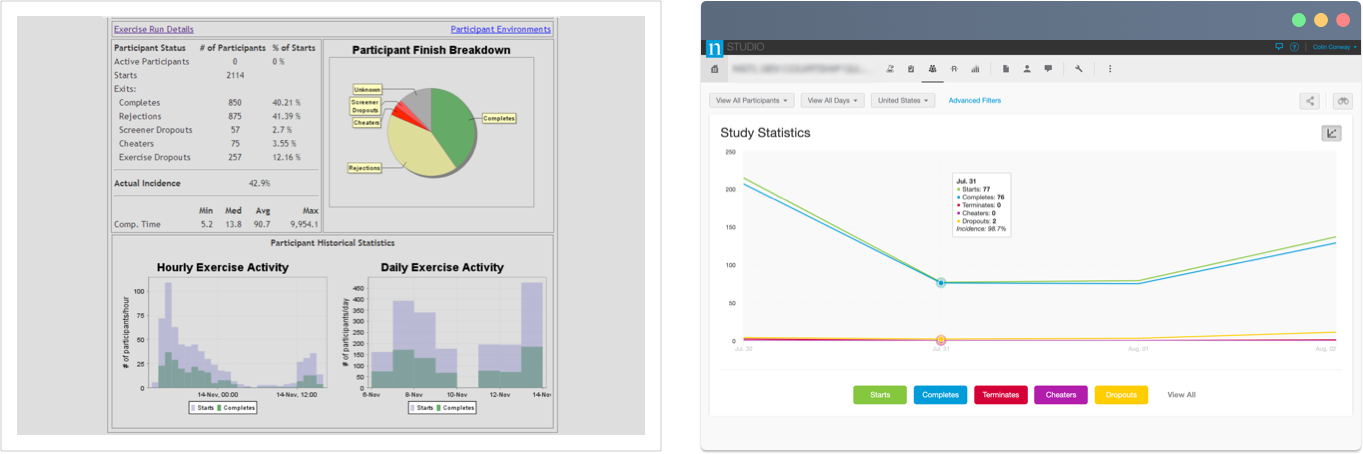
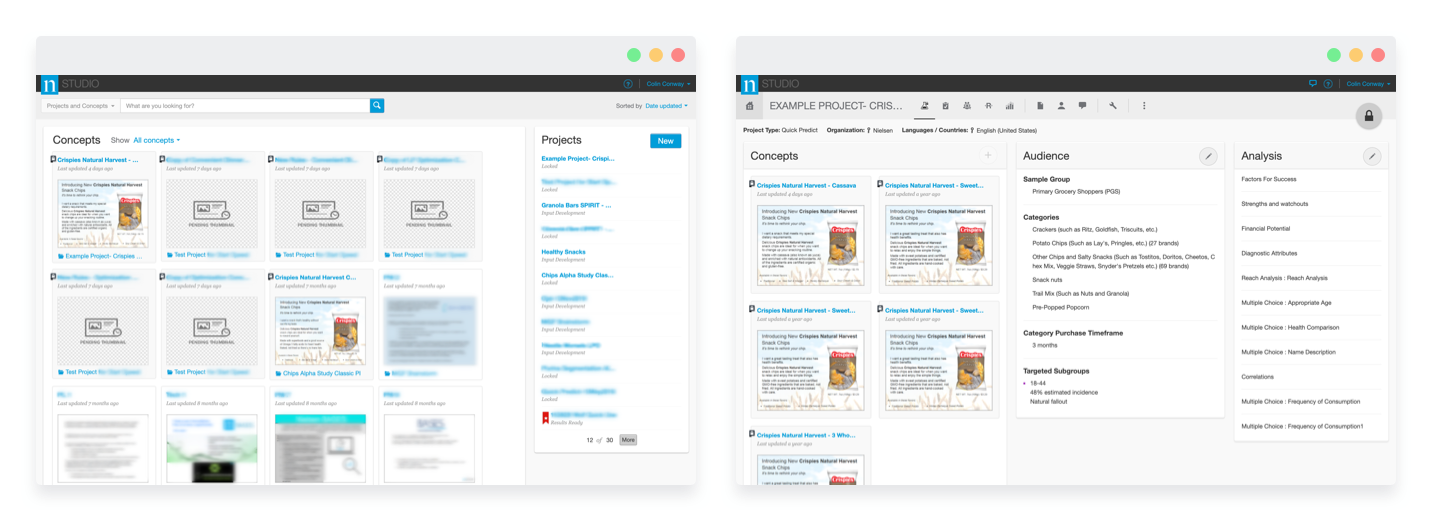
Scattered, convoluted views without accessible up-front data were rethought to centralize the way the data were presented, visualized and modified.
Once a project has completed the fielding process, data is ready to be synthesized in order to parse into reporting deliverables. A statistician will run code necessary for segmenting respondent data, adjusting demographic and weighting distributions, plus toggling specific features for deliverables.
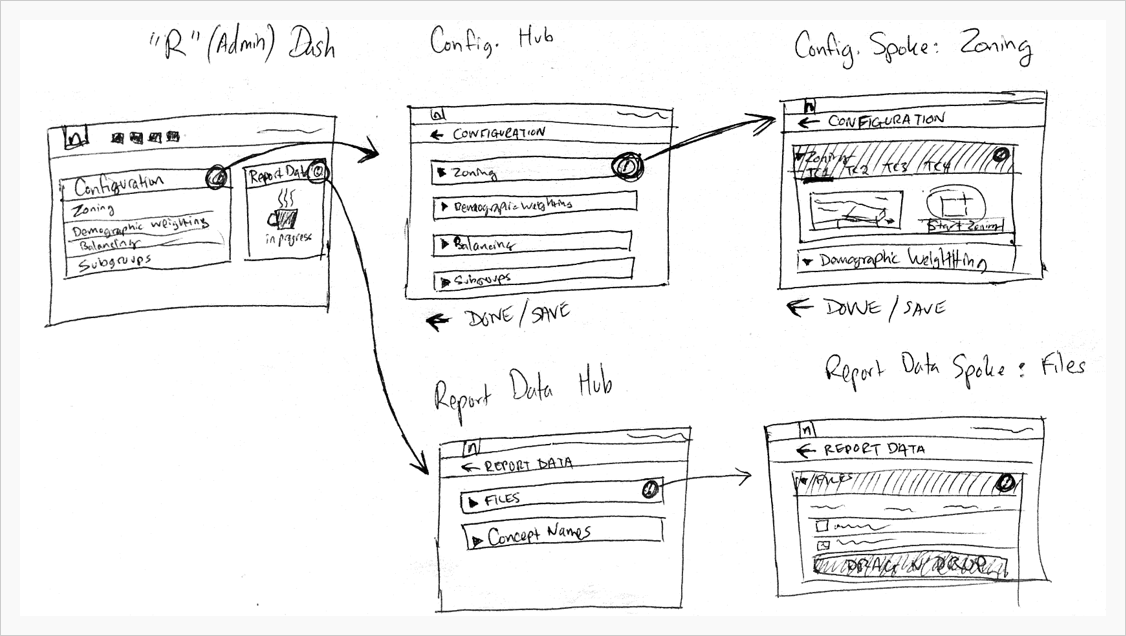
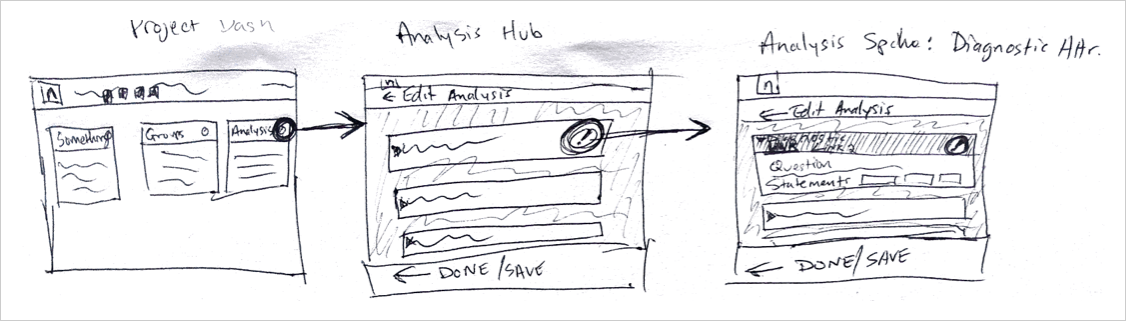
Sketches for the Analytics process
Screens for the Analytics workflow
Eliminating 300+ page decks, interactive reporting is a highly efficient way of providing actionable recommendations. Originally conceptualized to revolutionize client delivery, the notion was ambitious and getting it right took multiple iterations.
Although well-received in its formulation, getting clients out of PowerPoint in favor of a proposed better interactive solution met challenges in adoption. Addressing a generational gap that split preference, an editable PowerPoint solution was added for those who use it as their presentational norm.
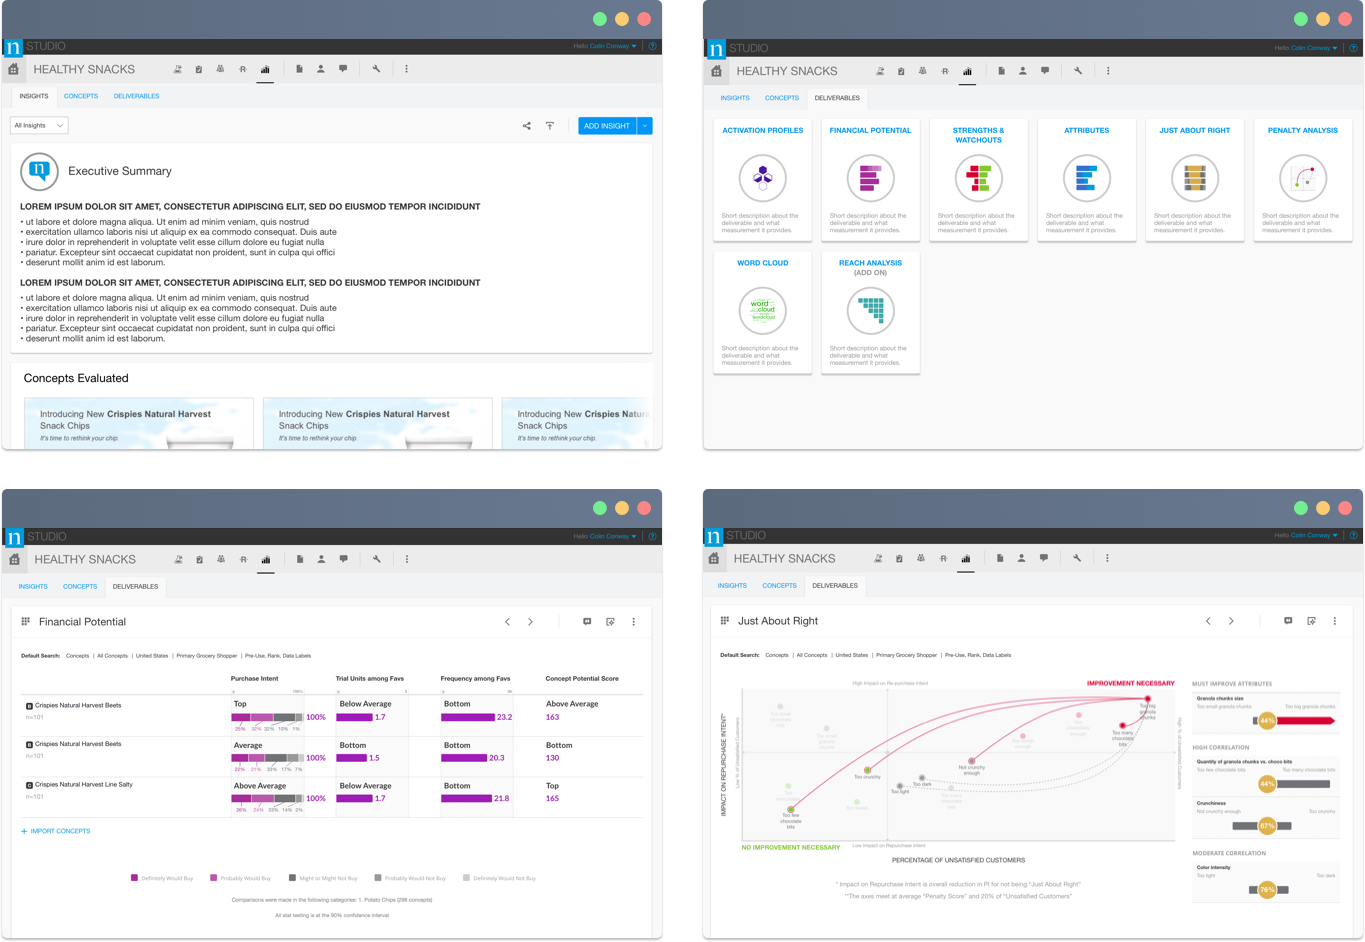
Navigation through interactive Deliverables and filtering within their respective data sets is the mechanism that creates insights constituting consultative narratives.