Survey Participant Interface
A device-agnostic, multi-exercise survey that spans various methodologies and business verticals.
A device-agnostic, multi-exercise survey that spans various methodologies and business verticals.
An outdated and highly inaccessible legacy survey interface that negatively affected field costs and internal operations was restructured for exercises spanning a myriad of methodologies and business verticals. I was responsible for modernizing the entire survey design to scale with new products on the platform and increase engagement with participants.
Originally a Hackathon proof-of-concept that generated an enthusiastic response, a modernized Participant Interface that could support all new and future products across all devices capitvated the business. Following an acquistion and deliberation on methodologies at an executive level, it became an intiative of its own shortly thereafter.
Organizational shifts left myself as the only remaining original team member throughout the entire project lifecycle. I was reliant on Product Management and Operations teams in sourcing the overarching knowledge of cross-product survey exercises so that we could scale accordingly. Development resources were simultaneously allocated to migrate all survey models and exercises into the cloud to support higher concurrency, improve response time, decrease completion times for respondents and therefore lower costs for the business.
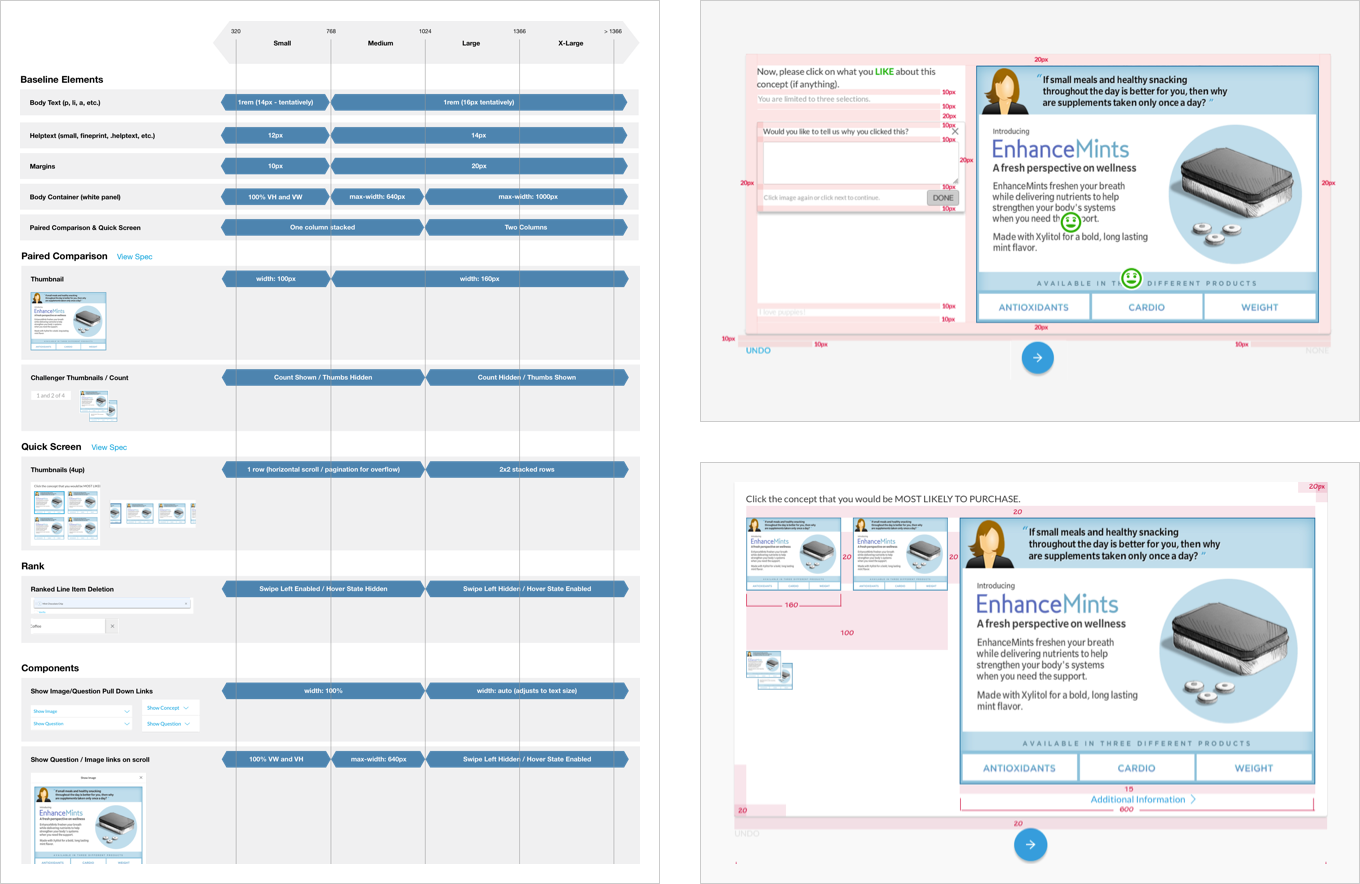
Evangelizing “mobile first” for responsive survey interfaces based on Bootstrap's framework was necessary for timing and cost.
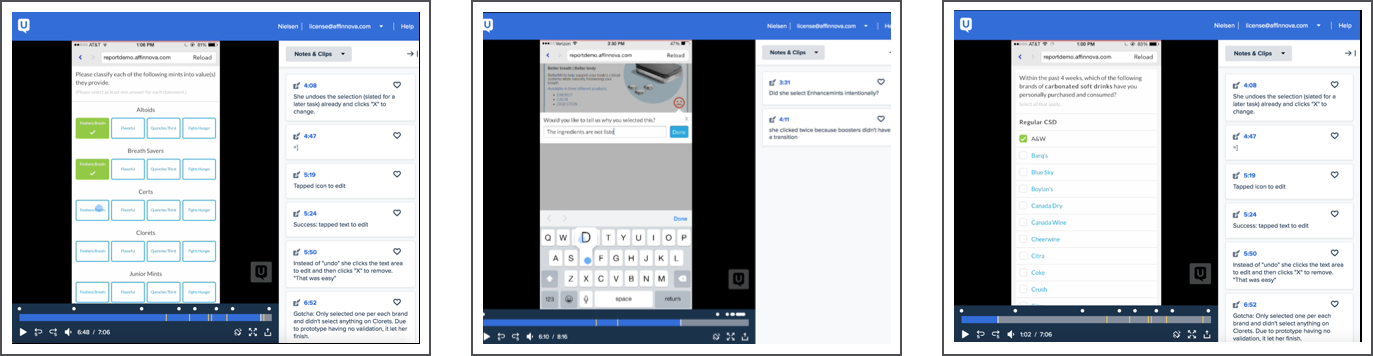
Data science perspectives were sensitive to support smaller screens as validation in place for desktop-only interfaces ensured data integrity and an optimal confidence ratio. Using learnings from previous tests, little risk was found to develop and pilot parts of the interface on mobile devices in order to get quantitative feedback that could better inform the design.
Thorough visual design research was done across a variety of survey types in order to discover common patterns in alignment to product methodologies and survey authoring.
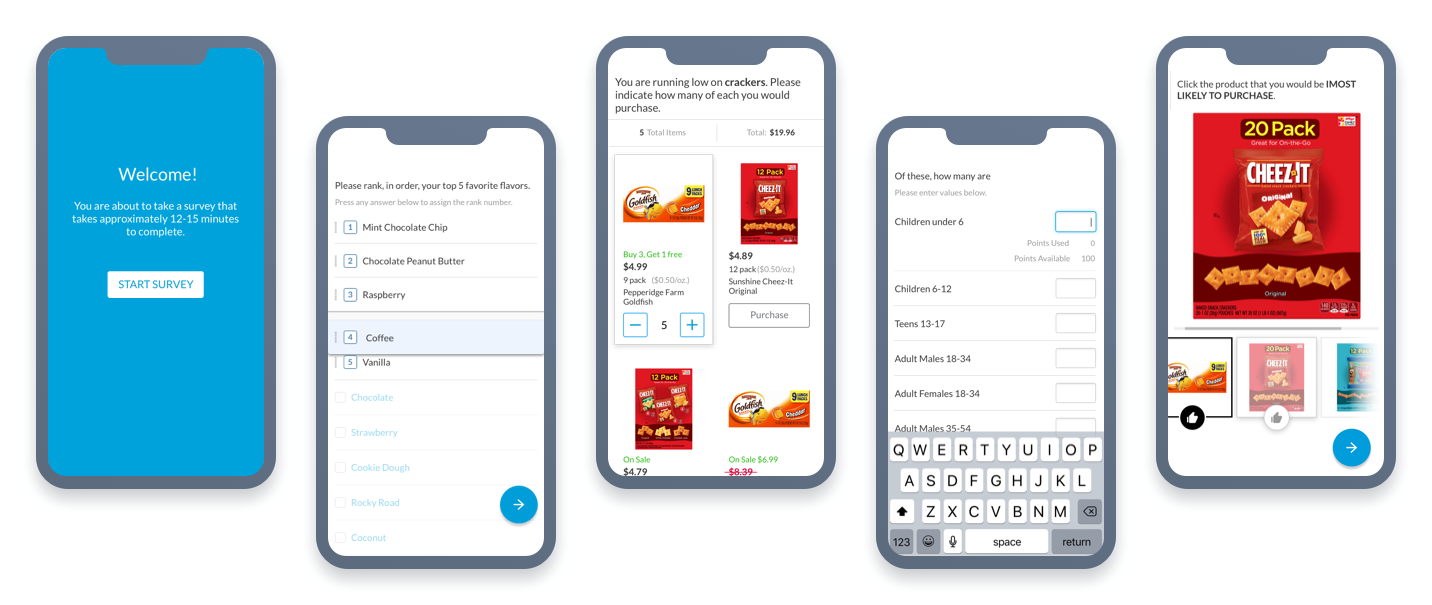
In many exercises, a fine line between business need and an optimal user experience required constraints that would prevent data distortion, user error and excess participant drop out rates. As the user constraints were put in place to aid the linear process of a taking a survey, the following were preserved:

A revitalization of affordances and attributes within the core functionality of previewing and selecting items was essential to scale and for accessibility on mobile devices. Products in focus can now show attributes such as price, promotions and additional information..
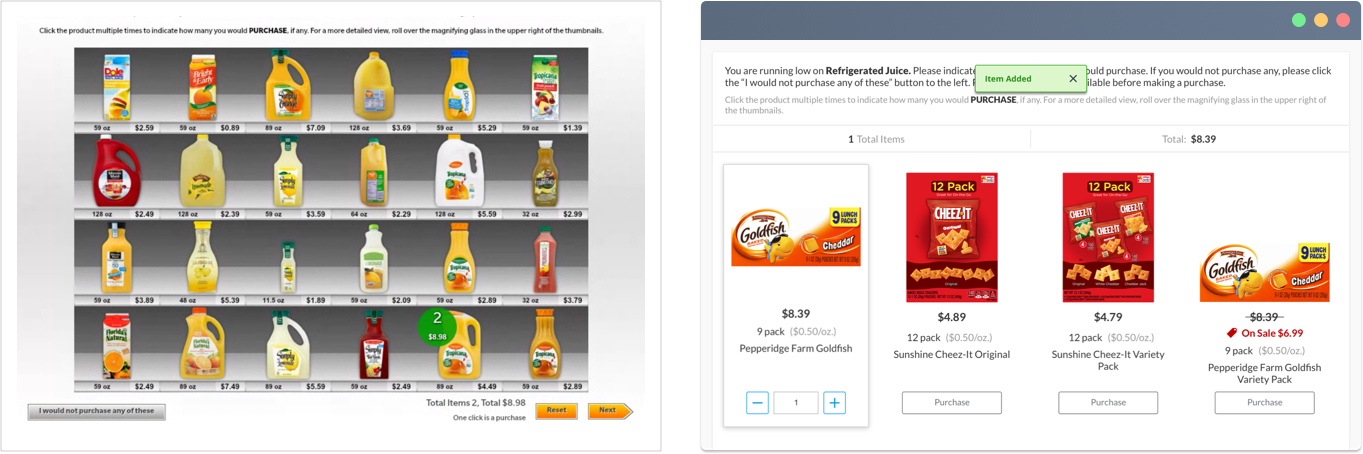
A former skeuomorphic brick and mortar shopping experience was converted to a modern "e-commerce" fashioned design. Telemetry data from rounds of pilot testing revealed little to no difference in data received from respondents, confirming it a sound solution.
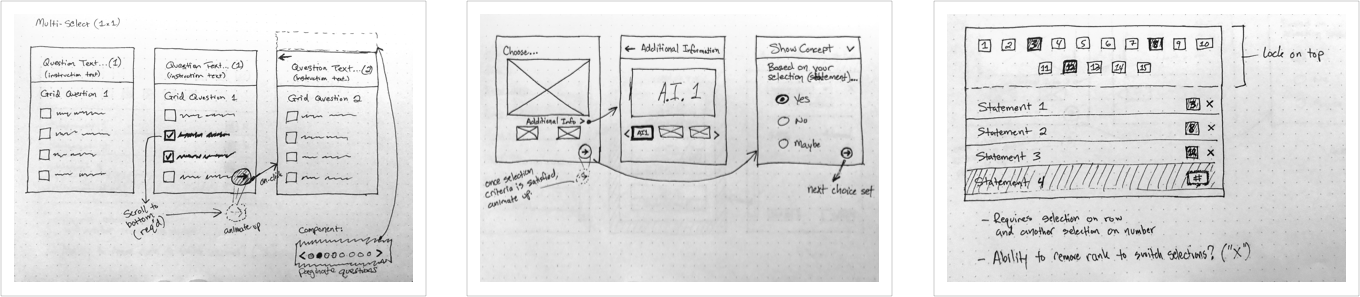
What started as code for a dynamic interactive prototype later became suitable code for developers to integrate into the framework. Although not the original intent, it massively reduced initial front-end development time.
Having a fully distributed offshore team required daily communication to get the basic framework done. Frequent follow up meetings often included live-design and front-end code reviews with GitHub as our method for version control. Guidelines were created to illustrate browser breakpoints for responsive design.
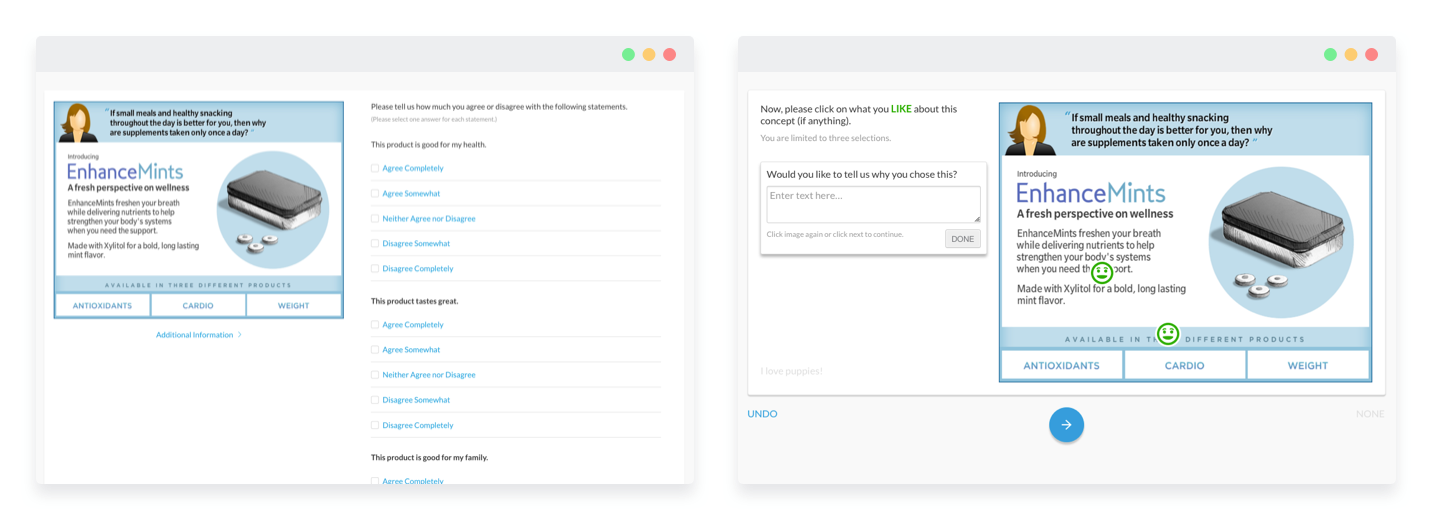
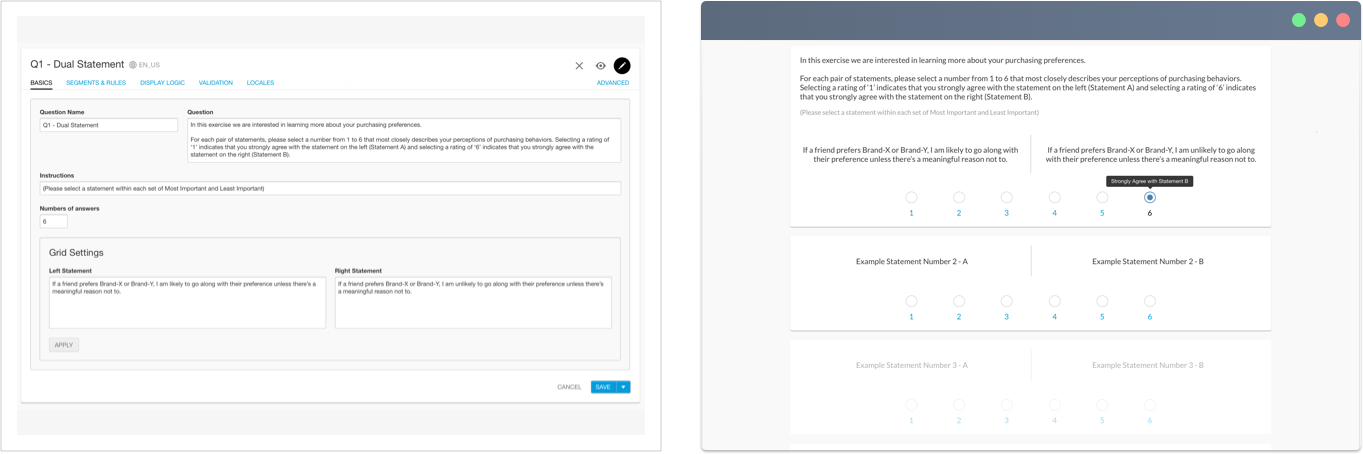
During survey authoring, there are many question types, each with their own complex logic and input for answers. The logic is often complex and there are templates for base questions, and advanced functionality for more detailed screener and diagnostic questions. The output reflects the fields entered within the editor and is the respondent-facing part of the survey interface.
Since its release, the mobile-first responsive survey interface has been instrumental in improved respondent completion rates. A reduction in survey drop outs by ~50% on mobile and 11.5% in aggregate across all devices has decreased internal operational costs while also increasing reach in emerging markets by replacing Central Location Testing where internet access comes at a premium. In addition, it supports all products on the Nielsen/BASES Studio platform and scales as products and their respective diagnostics evolve.